Third consecutive year in school spending increases marked a “full recovery” from the recession – By Jill Barshay, The Hechinger Report
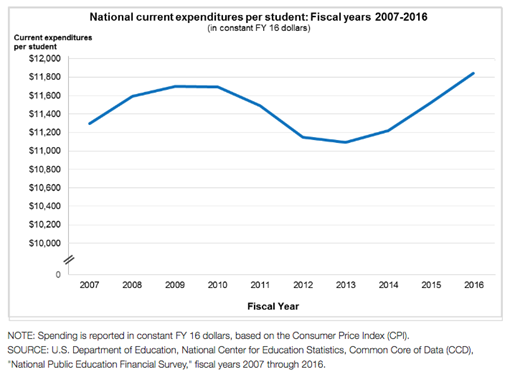
In school finance, this is as exciting as it gets.” That’s how Stephen Cornman, a statistician inside the U.S. Department of Education’s National Center for Education Statistics, described official figures confirming a “full recovery” in education spending in 2015-16, seven years after the recession.
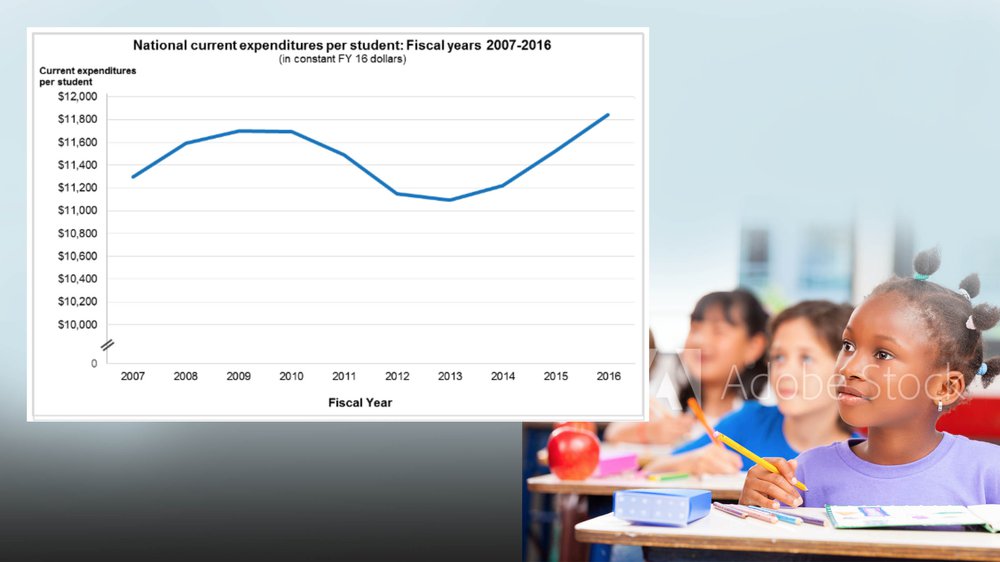
The adjective “full” emphasizes that even in real dollars, after adjusting for inflation, more resources were pouring into prekindergarten through 12th grade classrooms across the country than before state and local governments started cutting spending in the 2009-10 school year.
A December 2018 report that calculated funding in each state first revealed this national recovery. This additional May 2019 analysis is more detailed, crunching the dollars for each school district in the nation. It found that school districts spent a national average of $11,669 on each child, about a $350 increase from the prior year. That’s the third annual increase in a row after four years of consecutive spending cuts.
The recession lasted 18 months, from December 2007 to June 2009. Yet it took state and local governments until 2015-16 to restore their tax bases, muster the political will to approve spending increases and send the money to schools. The lag time between economic cycles and education spending is long.
Some of the biggest school spending increases were in California. Los Angeles increased funding by 9 percent between 2014-15 and 2015-16. Seven large school districts in California, including Oakland, Long Beach and Fresno, raised spending by more than 10 percent during that same year. Another notable jump was in Houston, which raised spending by almost 15 percent.

College Board to Add ‘Adversity Score’ to SAT in Hopes of Promoting Diversity – By Jeffrey R. Young, EdSurge
A story in the Wall Street Journal today brought national attention to a program by the College Board that assigns what the newspaper calls an “adversity score” to students who take the SAT.
The score is a number from 1 to 100, where 50 is average. Anything above 50 indicates a student came from a background of hardship, and anything less means relative advantage. In an example screenshot provided by the College Board, a sample student was shown with an “overall disadvantage level” of 86. The goal is to help colleges weigh the cultural and socioeconomic background of students as they review their applications.
The report brought a wave of national interest in the project—along with questions about how any group can accurately put a number on something like adversity.
College Board officials said Thursday that they have been talking openly about the project for more than a year, though they have never used the term “adversity score.” The group said the metric is part of what it calls an Environmental Context Dashboard, which it has been piloting in 50 colleges this year and hopes to roll out as a free service nationwide. The numbers are provided only to admissions officials, and not visible to test takers.

Oregon OKs largest expansion of federal free lunch program – By Sarah Zimmerman, AP News
Oregon is spending $40 million to dramatically expand its federal free breakfast and lunch program, ensuring that more than 60 percent of its 400,000 public school students will be included, the largest statewide effort in the country.
The program is based on providing free meals to any child whose family lives at up to three times the poverty level, which is $75,000 for a family of four.
The meals expansion program is tucked away in a new tax package for schools, a sweeping $1 billion annual investment explicitly dedicated to boosting student performance. It will be paid for through a new half a percent tax on business.
Chicago and New York City are among some major cities that offer free breakfast and lunch to all students, but this is the only statewide program according to Partners for a Hunger Free Oregon.

Non-Degree Credentials Boost Employment and Life Outcomes – By Rhea Kelly, Campus Technology
American adults who have earned certificates or certifications, but lack a college degree, still report better employment and life outcomes than individuals with no credentials, according to a new report from Strada Education Network and Lumina Foundation. Based on data from the Strada-Gallup Education Consumer Survey, a nationally representative poll of 50,000 U.S. adults ages 18 to 65, the report found that non-degree credentials result in greater marketability, employment rates, incomes and happiness with one's educational path.
"As the country redesigns policy and works to improve and expand postsecondary education and training, it is critical that we talk to education consumers about their experiences and the value they get from different types of education," said Carol D'Amico, executive vice president of mission advancement and philanthropy at Strada Education Network, in a statement. "Through this new research, we're seeing that not only do short-term credentials and certificates deliver an immediate impact for adults looking to upskill, but they also have the potential to foster the sort of wage increases needed to sustain a family and power true social and economic mobility."
Among the report's findings:
- Adults without a degree who hold a certificate or certification have an 85 percent full-time employment rate, compared to 78 percent for their peers with no credentials;
- The self-reported median annual income for people with non-degree credentials is $45,000, compared to $30,000 for those without credentials. However, these wage premiums vary based on occupation and gender; and
- People with non-degree credentials "perceive their education paths as more valuable and are more likely to recommend them to others than are those without credentials."


