Redrawing school boundaries can be a nightmare of balancing competing interests and goals. If you find reasonable boundaries that put the appropriate number of students in a school, you may find that the student population is segregated by race. Once you address that issue, you may find that one school is full of students from wealthy families and another has a sky-high free and reduced lunch rate. Redraw everything to even out the economic distribution, and you might find that too many of your students are spending hours each week on the bus to and from school. Add in families worried about the impact new boundaries might have on their children’s education, and the whole project can feel a little hopeless and completely thankless.
At Muskogee Public Schools, however, we found that with appropriate communication, plenty of data, and the right tools to make that data accessible and easy to understand, redrawing boundaries doesn’t have to be a chore for administrators or an emotional roller coaster for parents. On the contrary, it might even help to uncover some new opportunities for your district.
Show, Don’t Tell
We recently had to redraw our school boundaries because of declining enrollment. The birth rate in our district has been dropping for some time, and, coupled with a greater number of students choosing nontraditional schooling options such as online education, our student population had dropped enough that we decided to close one elementary school and convert it to a 6th grade center and to close a middle school completely, leaving us with five elementary schools that serve approximately 2,700 students.
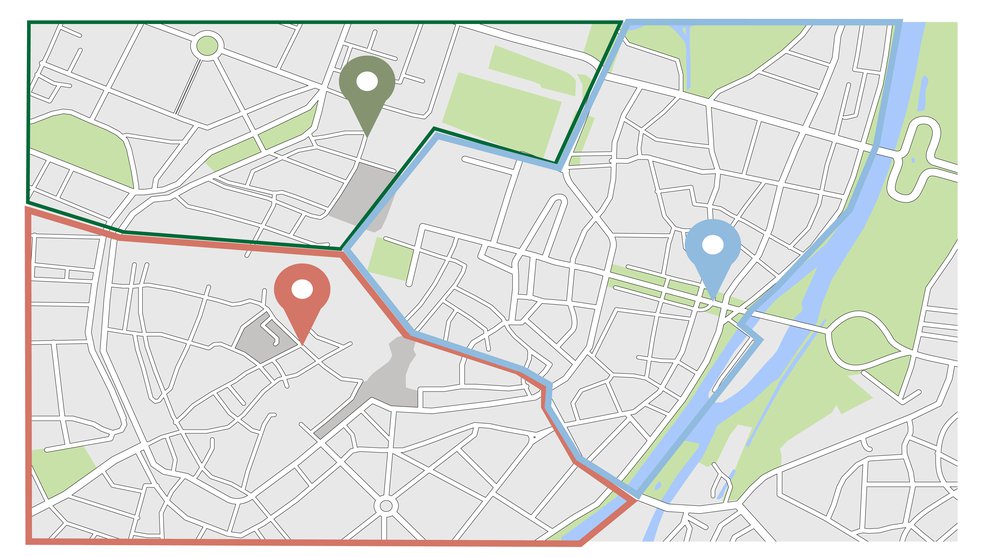
Our long-range planning committee, comprising 35 community members selected by our school board, superintendent and other community leaders, decided to adopt a geographic information system (GIS) to ensure that we were working with accurate data and presenting it to decision makers and community members in an easy-to-understand format. We settled on ONPASS® Pro, from Educational Data Systems, a company we had worked with for years.
Once we began looking at the data on a map, one bit of information we uncovered came as quite a surprise.
We were operating under the assumption that all our schools were neighborhood schools, but upon review of our data, we quickly found that our assumption was wrong for one school in particular. It’s in a great neighborhood, but the population in the entire area was aging and about 65 percent of the students in the school were actually intra-district transfers. It was hard for us to believe, but only about 80 kids in that school actually lived within the school zone.
With our GIS tool, we were able to quickly explore a range of redistricting possibilities. We created five different scenarios, presented each to the planning committee and community for feedback, and ended with a much better representation of the neighborhood.
We had a different challenge with trying to ensure economic diversity throughout our district. Like many municipalities, we have pockets of low-income housing, but we didn’t want one demographic group concentrated in a school, so we used our data tool to come up with a more equitable solution.
Making those changes in both cases was technically easy, but emotions tend to run high when you tell people something they’re used to is going to change, particularly if that change affects their children. But with the data visible to everyone, change made a lot of sense to people.
Once they saw the facts, the lay of the land, they were on board with the plansAnother example came from an elementary school on the west side of town. People didn’t understand why the zone for one school encompassed 45 percent of the district’s geography. Once they saw the map and it became clear at a glance that there just weren’t any students over there, it clicked.
Finding New Opportunities in the Data
Throughout the process, we were fortunate to uncover some new opportunities that we hadn’t been considering before.
In one of the more economically challenged neighborhoods that we wanted to feed into other schools, we saw an opportunity to repurpose the existing school to a magnet school focused on project-based learning. We’re hoping that it will not only change the dynamic of that building, but maybe even help to revitalize the neighborhood a bit.
We also improved our understanding of our transportation needs. The GIS tool we used is not designed for transportation planning, but we used it to track which students ride the bus. Paired with all the other student data we were poring over, we got an eye-opening look into just how many students we transport here. We’ve always tweaked our routes to improve service, but now we have the power to combine data and see some significant changes to improve efficiency.
In the end, the school board makes the final decision about how to redraw boundaries. But the school board works for the public, and that public is not always in alignment with the decisions the board makes. The best way to keep them on the same page is to make sure everyone is well informed every step of the way.
Eric Wells is the chief admissions officer for Muskogee Public Schools. He can be reached at eric.wells@roughers.net.


